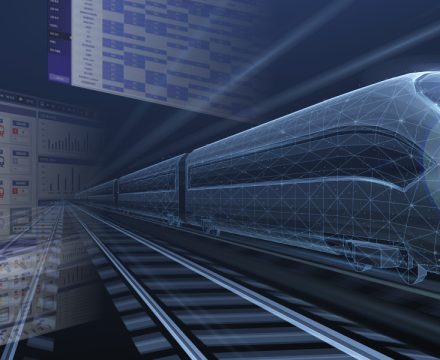
As part of the Condition Based Maintenance (CBM) system, Hyundai Rotem is developing a real-time diagnostic monitoring platform and a big data analysis platform to predict real-time diagnosis and fault of trains and parts using various data collected from railway vehicles. In addition, while advancing the real-time diagnostic monitoring platform based on big data analysis technology, it is also preparing digital twin technology for the hydrogen integrated control system by using operation and fault data of hydrogen-electric trams and hydrogen charging facilities.
The diverse and enormous amount of data required for these technologies is called big data. In order to utilize big data in the direction desired by users, it is necessary to go through a data preprocessing process that filters out and organizes unnecessary data. According to Forbes, a global economic magazine, the data preprocessing process is the operation that analysts put the most time and effort into in the process of big data analysis. It is said that 60% of the total analysis time is used to refine and organize data. This is the reason why Hyundai Rotem pays attention to data preprocessing technology.
Big Data, Information assets that determine future competitiveness
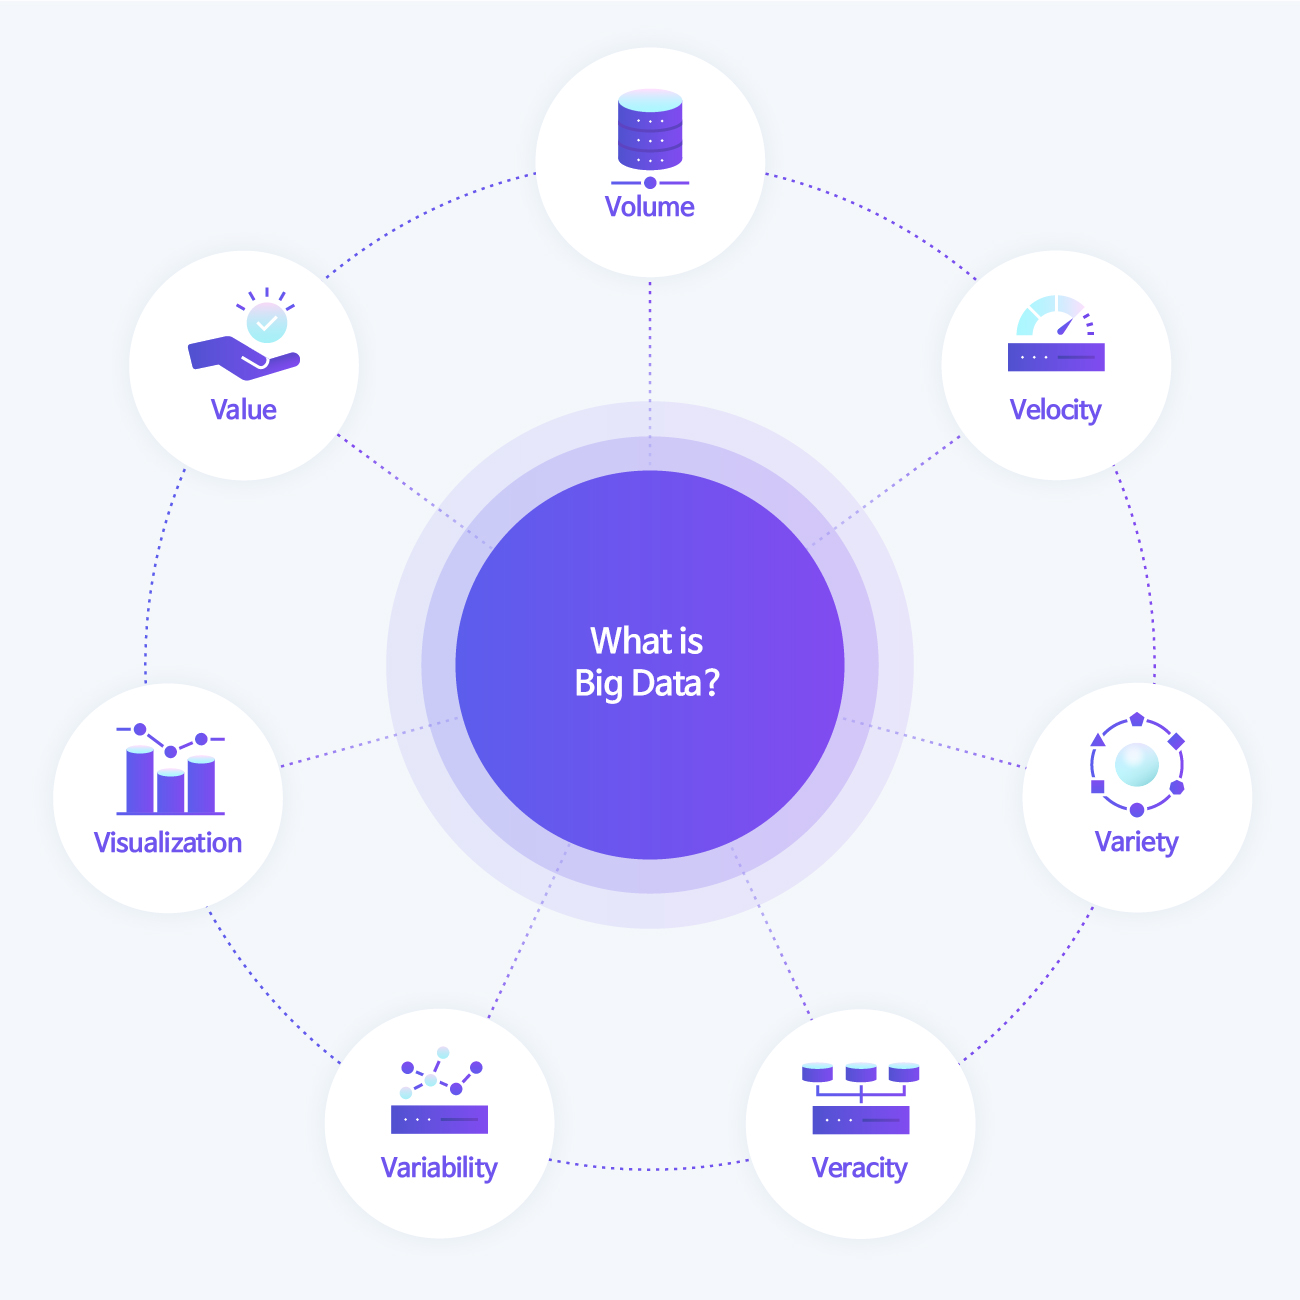
Before looking into data preprocessing, it is necessary to understand big data. Big data is a huge amount of data generated in real-time in a digital environment. As time goes by, it increases exponentially, and big data includes not only information in numbers and letters, but also unstructured data such as photos and videos. In the early days, only the so-called 3V, Volume, Data Velocity, and Variety, were selected as the properties of big data. However, with the development of IoT sensors and ICT technologies, veracity, variability, visualization, and value have also been added to the conditions of big data.
A vast amount of data resources can be utilized for various businesses. From marketing to producing products according to demand forecasting and providing services based on consumption propensity analysis, it derives useful values in various fields through big data analysis. McKinsey, a global consulting firm, predicts customer behavior through big data in advance and prepares countermeasures. They also predicted that productivity improvement and business innovation are possible by enhancing a company’s competitiveness through big data. As such, big data is the core of information assets that go beyond a simple resource and affect a company’s future competitiveness and survival.
Data Preprocessing, A series of operations that transform big data into useful information.
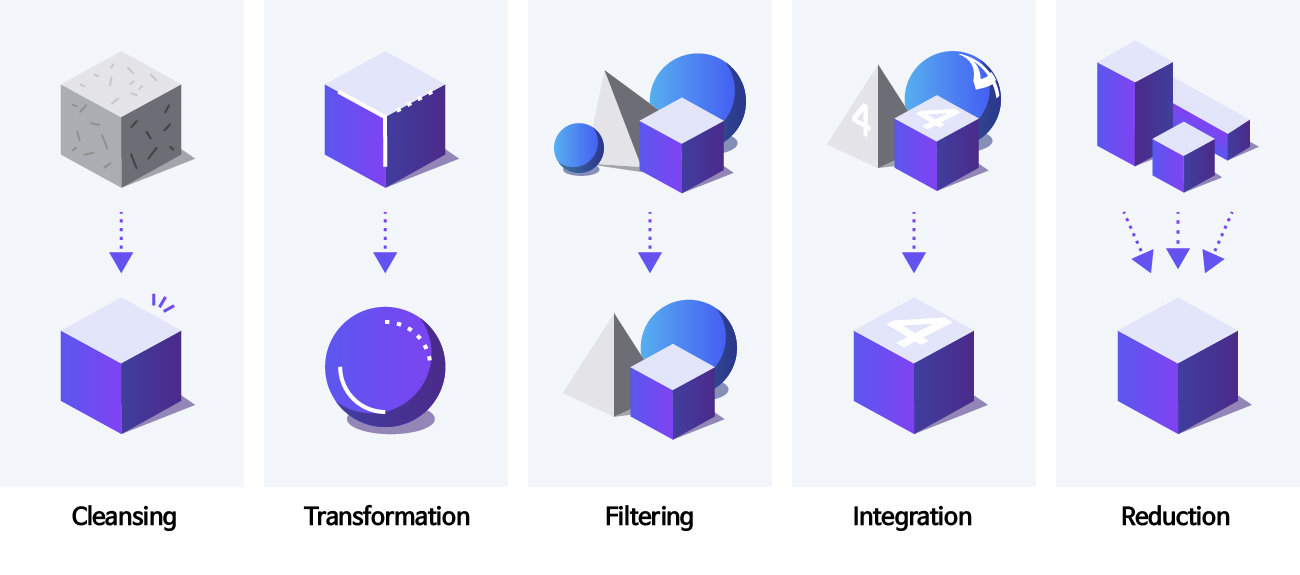
In order to use the collected big data effectively, it is necessary to form a huge amount of raw data in a form suitable for the purpose and method of analysis. Therefore, unnecessary information is separated, engineering, and then removed, and this series of processes is called data preprocessing. The collected data must be effectively engineered for the purpose of use. The following preprocessing methods are used so that the original information of the data is not distorted or modified.
·Data Cleansing: Technology that cleans data by compensating for missing values in data and removing bouncing values as outliers
· Data Transformation: Technology that transforms data to make data analysis easier to achieve consistency and minimizes data duplication to save data analysis time
· Data Filtering: Technology that detects errors in data and improves data quality through deletion and correction
· Data Integration: Technology that integrates data, such as linking data with similar properties to facilitate data analysis
· Data Reduction: Technology that excludes data not used in the analysis from the analysis target to shorten the data analysis time

Then, what kind of procedure and method is required for data preprocessing to efficiently and reliably analyze the collected big data? Data preprocessing proceeds in the order of identifying the collected data set, treating missing and outliers that may affect the data analysis results, and engineering features to add useful information to facilitate the analysis of features used in actual analysis.
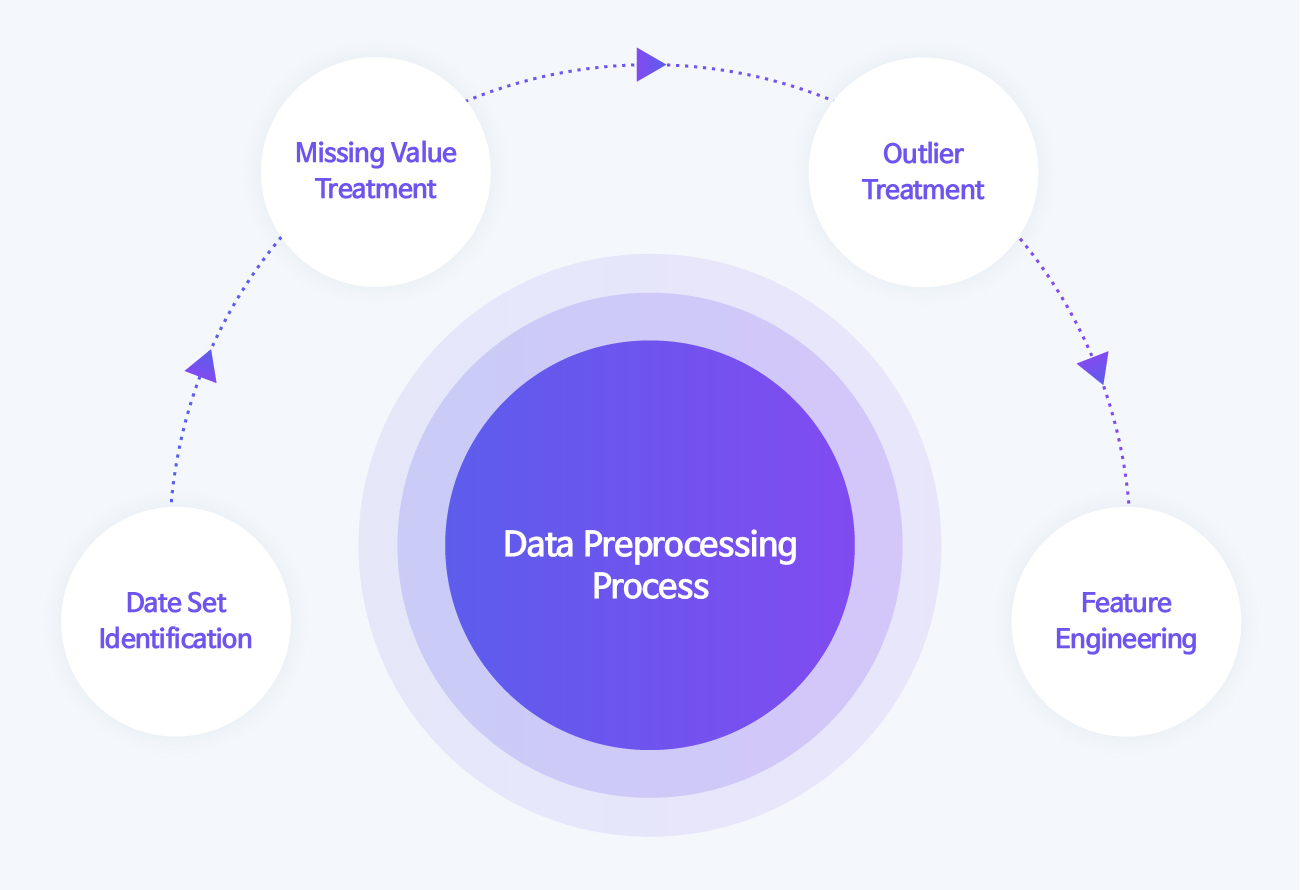
Data Preprocessing Step 1, Data Set Identification
Data preprocessing is a process of analyzing information required to solve problems by identifying information from data through a total of four steps: data set identification, missing value treatment, outlier treatment, and feature engineering. The first data set identification operation is to identify the data. It can be divided into the method of identifying the features of the data and the method of identifying the raw data.
1) Data Feature Identification
The feature to be analyzed. There are three methods to identify continuously changing data features.
· Feature Definition Identification: Separating between independent features (causes) and dependent features (results)
· Feature Type Identification: Separating between qualitative and categorical type and quantitative and numerical type. Among quantitative and numerical data, separating between continuous type if it has a trend and discrete type if it doesn’t have a trend.
· Feature Data Type Identification: Separating dates, numbers, text, images, etc.
The following describes the data of the train door as an example.
· Door Feature Definition: Separating the closing time as a dependent feature and obstacle detection as an independent feature
· Door Feature Type: The type and line of the train are qualitative and categorical features. Separating the door closing time and obstacle detection count into quantitative and numerical features.
· Among door features, if there is a trend of increasing or decreasing closing time, it is separated as a continuous feature. In addition, things expressed only in the number of events without a trend, such as the number of obstacle detections, are separated as a discrete feature.

2) Raw Data Identification
Once you’ve defined your data, you need to look into the raw data to see how to analyze it. There are three methods to identify the raw data as follows.
· Unifeature Analysis
· Bifeature Analysis
· Multifeature Analysis
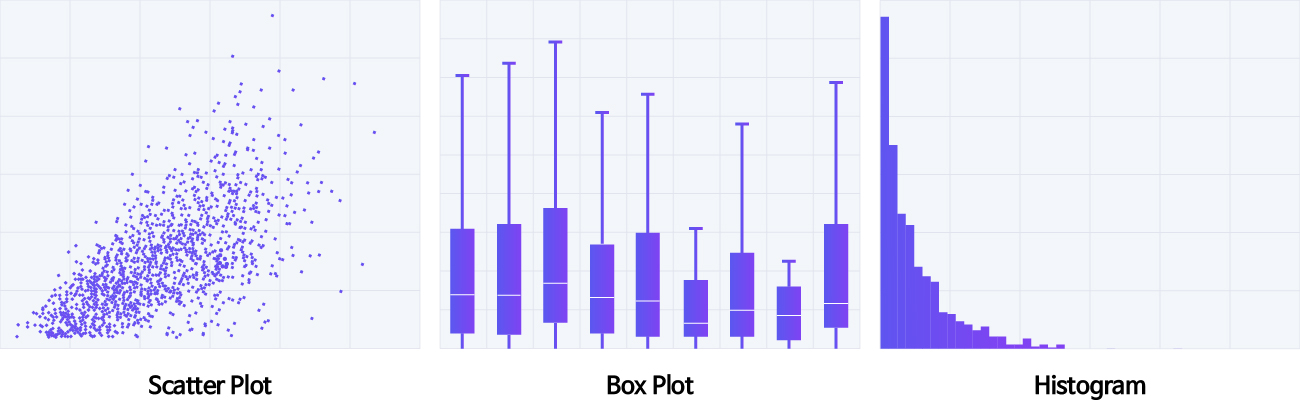
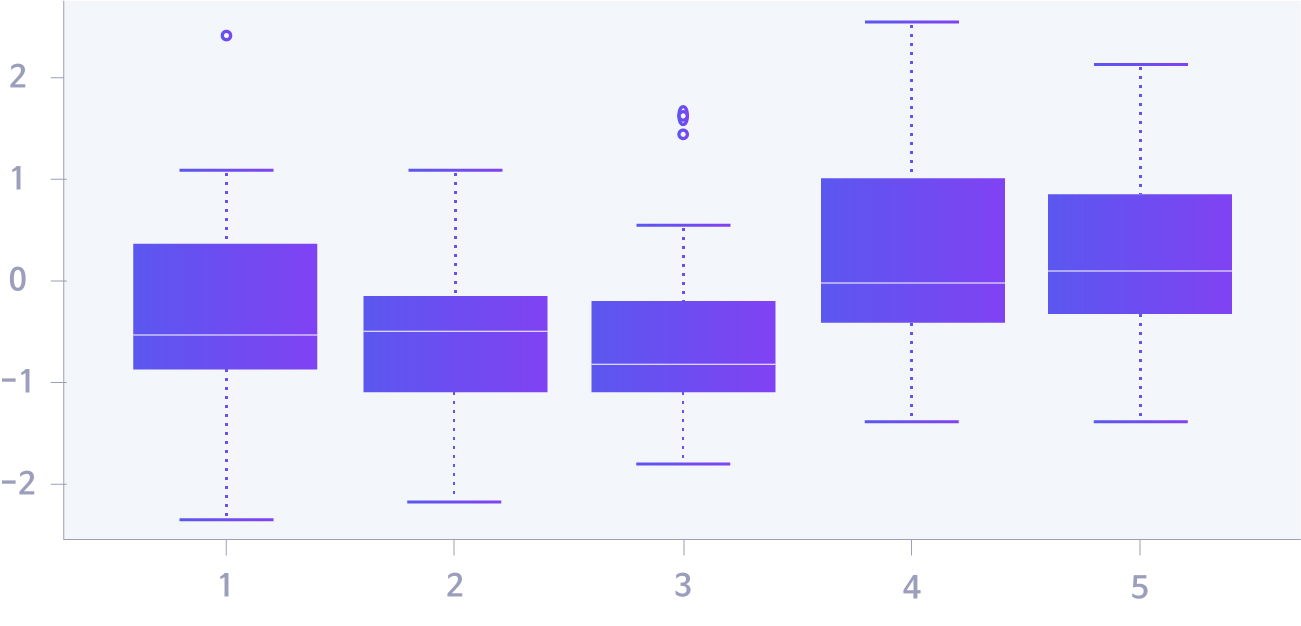
The unifeature analysis is a method that can analyze the distribution of features such as mean, mode, and median of raw data by identifying and analyzing a unifeature, that is, one data distribution through graphs such as scatter plots, box plots, and histograms.
The bifeature analysis method is used to identify the distribution of two data, and the graph and analysis method used may vary depending on the type of each feature. The analysis method differs depending on whether both features are continuous or categorical, or whether one feature is continuous and the other is categorical.
The bifeature analysis can be given as an example.
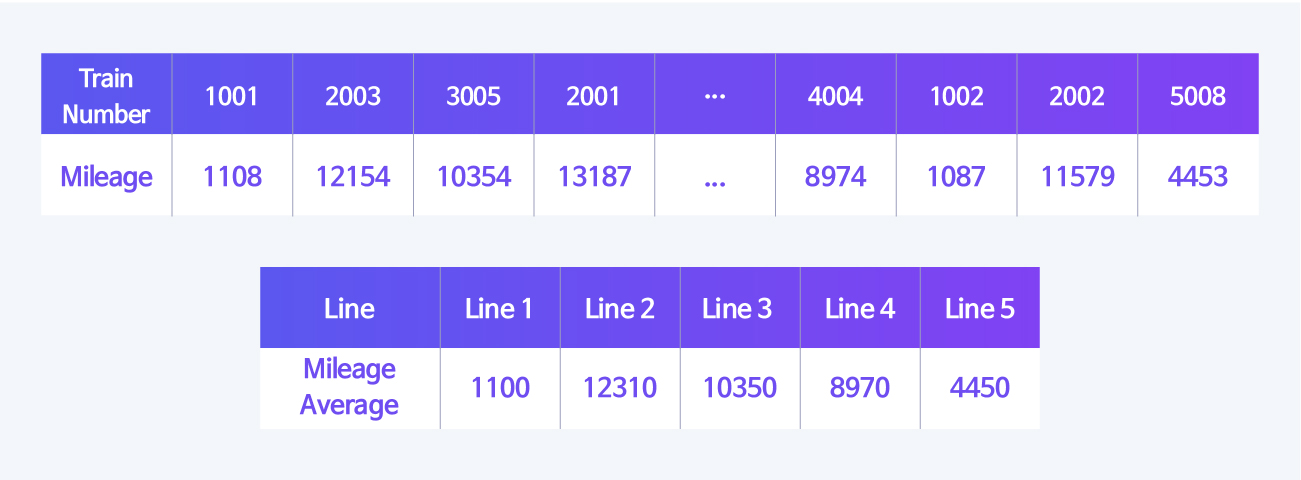
· If both bifeature are continuous: The number of passengers and door opening/closing time are both continuous features. The correlation between these features can be analyzed using a scatter plot with a trend line.
· If both bifeature are categorical: Both the transfer station and the obstacle detection event are categorical features, and the correlation between the two features can be analyzed through the cumulative bar graph.
· If both bifeature are of different types: The significance of the continuous feature of a door opening and closing time and the categorical feature of the transfer station with the transfer station can be analyzed through the cumulative bar graph and histogram by category by using the information on the opening and closing time of each transfer station made of two features and analyzing the opening and closing times of all the stops.
Data Preprocessing Step 2, Missing Value Treatment
In the process of collecting and inputting data, of course, missing values occur. These are called missing values. If a data analysis model is created with missing values of features, the relationship between features may be distorted, and the veracity of the model will decrease. This also creates problems for the visual representation of data. There are many different types of missing values. How these missing values are treated depends on whether they are random or related to other features. For this reason, the methods of treating missing values are largely divided into deletion, replacement, and insertion, and each method also has a slightly different processing method depending on the case.
First, there are two methods for deletion: a method of deleting all features (data) with missing values and a method of deleting partially occurring missing values from features used for data analysis. While the full deletion method for treating missing values is simple, the number of data used in the analysis is reduced, which lowers the reliability of the analysis results. The partial deletion has the disadvantage of increasing the time it takes to process missing values because the features used are different. The preprocessing time is also increased because missing values must be excluded only for the features used in each analysis.
The following is a method of replacing the original feature with a value other than using the original feature. This is a method of replacing the mean, mode, and median values of other features when missing values occur. It can be divided into the batch substitution method, which obtains the mean value of all features and substitutes them at once. The similar type substitution method uses the categorical features to substitute the mean value of a similar type.
Insertion is a method of creating a model that predicts missing values by using measured values (observed values) as training data. In this case, the regression analysis method is mainly used. Predicting missing values through predicted values has less effect on the reliability of analysis results than the substitution method because it is based on actual values.
Data Preprocessing Step 3, Outlier Treatment
Outliers are data that are far from the collected data (sampling data). They usually refer to a very small value or a very large value. It is desirable to remove such data because it reduces reliability when creating a data analysis model.
To do this, we first need to find outliers. An easy and simple method is to visualize the distribution of each feature in the data. In general, finding outliers for one feature uses a histogram or boxplot, and a scatterplot between two features. The method to visually check through the graph is intuitive enough that it can be grasped at a glance. However, it is inconvenient to reflect the analyst’s arbitrary judgment or check the figures. Therefore, a regression equation between two features is sometimes used as a method to find outliers between two features.
If you find an outlier, you can treat the outlier in the following method.
・ Simple Deletion
・ Substitution of Other Values
・ Featurization|
・ Resampling
・ Separating and Analyzing Cases
Simple deletion corresponds to atypical data that is difficult to quantify, such as a simple typo or a subjective questionnaire, or an error in the data processing process. In addition, cases due to human error in data collection or preprocessing are also included. In this case, the corresponding measured value (observed value) is deleted.
In the case of substituting other values, the amount of collected data is small, so if an outlier in the data is deleted, the absolute amount of the target data to be analyzed becomes smaller, which causes a reliability problem in the analysis result. In this case, instead of deleting outliers, replace them with other values such as the mean, or create and replace predicted values, such as inserting missing value treatment using other features.
The featurization method creates an analysis and algorithm model by creating a single feature rather than deleting or replacing one of the data generated in the data collection process rather than an outlier caused by human error or lack of data.
Resampling is similar to the featurization method, but it is a method of reanalyzing only the remaining data after excluding only the analysis target from the normally collected data and treating the remaining data as outliers. For example, as a general example of data on the distance traveled by train and the number of openings and closings of the room door, the longer the distance traveled, the more often the door is opened and closed. However, there are cases in which the number of openings and closings of the room door is very high or very small, regardless of the driving distance. In this case, abnormal values can be processed by featurization or resampling the data by checking whether the train is faulty or checking after repairing the breakdown of the room door (opening/closing test).
Case separation analysis is a method used when the reliability of data analysis results is still low even after resampling the collected data. In addition, it is a method that determines that the existence of an outlier does not affect the result regardless of whether the outlier is deleted, and processes the outlier by adding an ambiguous explanation.
The Final Data Preprocessing, Feature Engineering
A series of processes of adding information to existing data using domain knowledge and existing features is called feature engineering. This is the last stage of data preprocessing, and it is a method to make existing data more useful without adding new data or features. In addition, the results and significance of feature engineering may vary greatly depending on domain knowledge.
Feature Engineering can be categorized into 4 methods as follows.
· Scaling
· Binning
· Transform
· Dummy

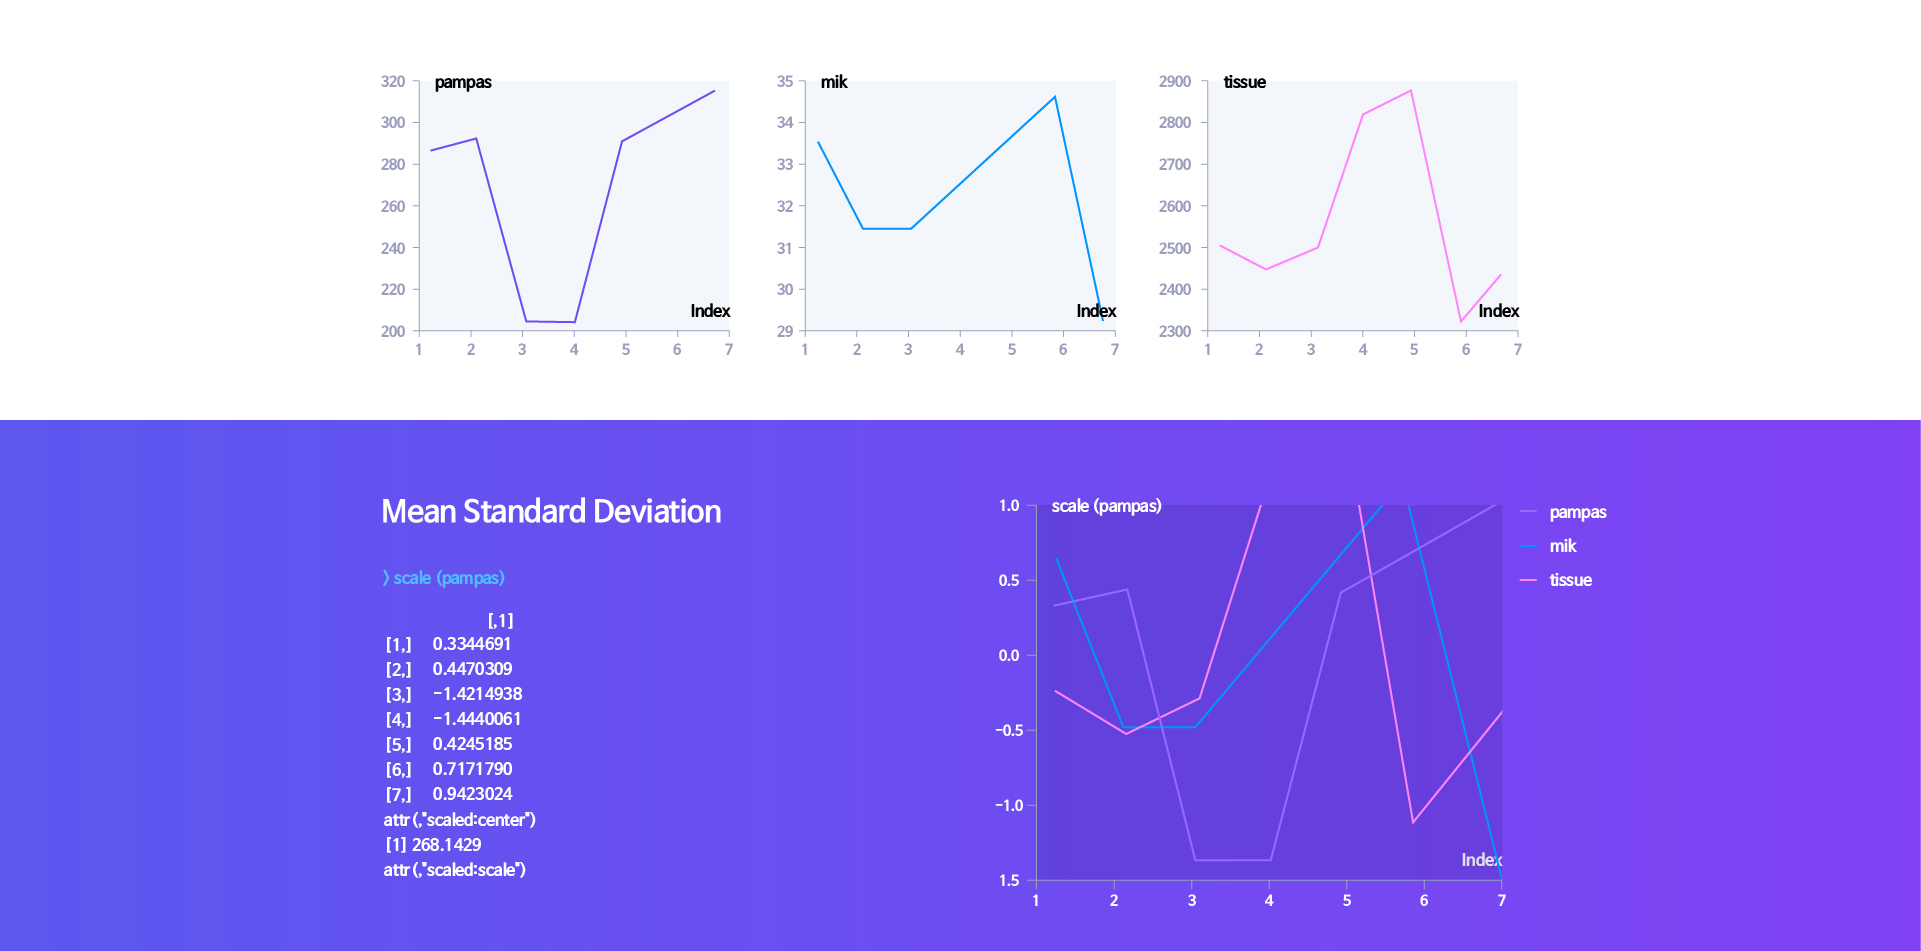
Scaling is used when the data unit is changed or the data distribution is biased and the relationship between the data is not clearly revealed. In general, this method is used when the unit and range of data are large in Excel. The log function is used the most, and there is also a square root similarly.
Binning is a method of making continuous (numeric) data into categorical data. In consideration of the area to be analyzed, the data is divided into specific sections and converted into categorical or ranked data. Since there are no principles or rules for this, it is better to make the most of the analyst’s domain knowledge according to the required area, such as the purpose and method of analysis.
Transformation is for transforming and analyzing the characteristics of existing data or other information into other data. As with the method of binning for the data to be analyzed, it is not a method with a set principle, and thus various data may be created according to the analyst’s understanding of the data characteristics.
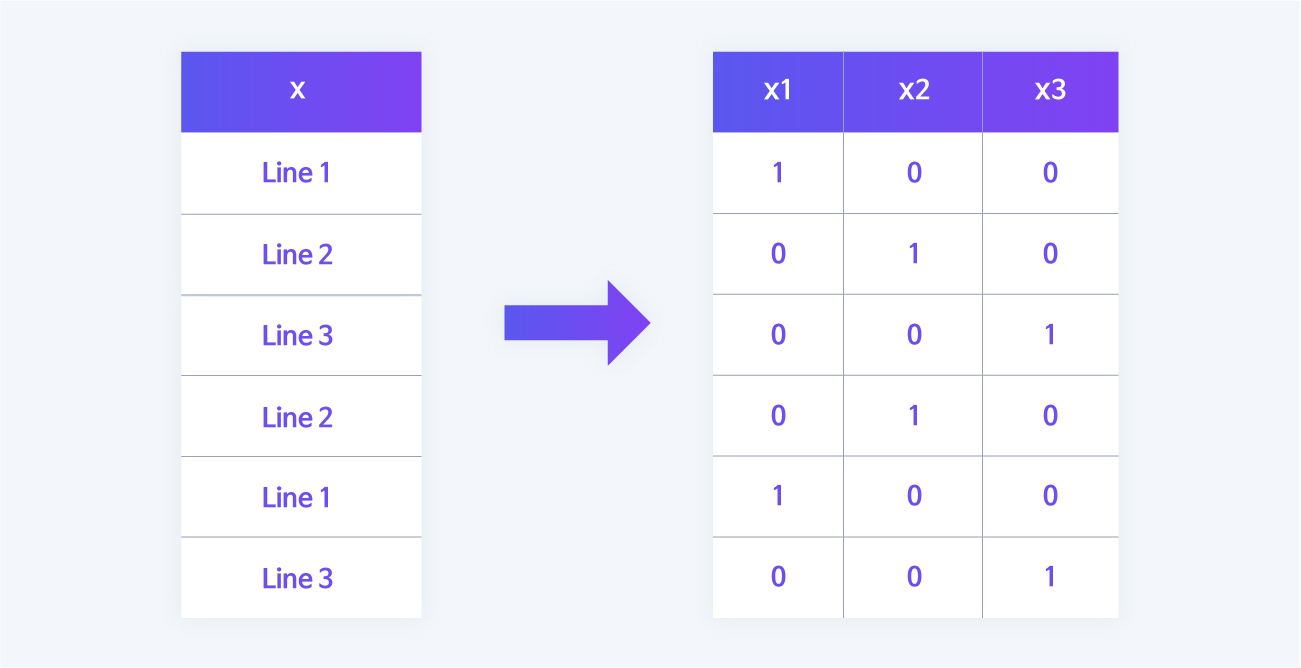
The dummy is a method of converting categorical data into continuous (numeric) data as opposed to the binning method. Since most data analysis models are mathematical equations in which analysis is performed with numerical data, virtual data must be converted into numbers. Therefore, if you need to separate three routes, as in the example below, you can define and convert three-digit numbers into binary numbers.
Big data is positioned as an essential technology and core in the future industrial environment. Hyundai Rotem also plans to develop a real-time diagnostic monitoring platform including railway vehicles by building a big data analysis system, and plans to complete the hydrogen integrated control system necessary to create a future hydrogen city. As such, Hyundai Rotem is investing in efforts to secure big data analysis technology capabilities and strengthen them in order to provide better train operation and maintenance services while looking forward to the future.